Friday, November 5, 2010

Mastering Financial Planning: A Comprehensive Guide to Securing Your Future

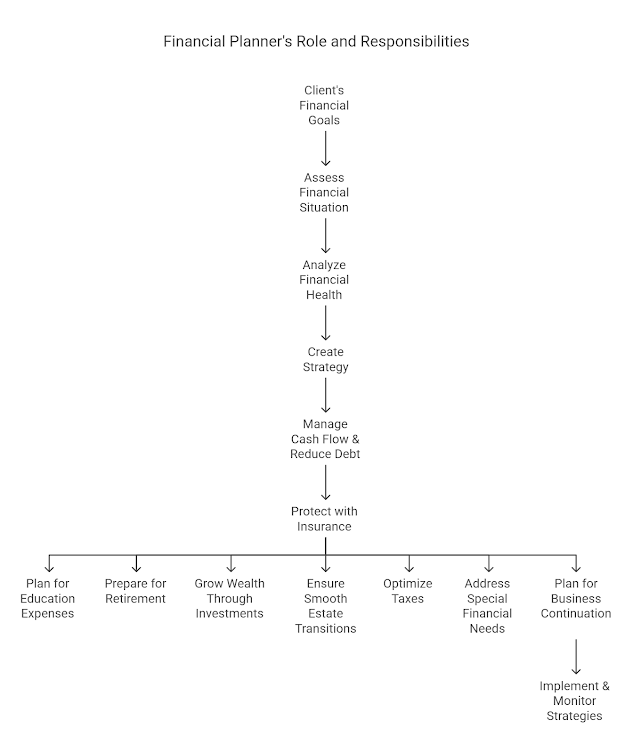
Comprehensive Financial Planning Outline

Introduction

Financial planning is not just about managing money—it’s about building a future that aligns with your dreams and aspirations. Whether you’re striving for early retirement, securing your family’s financial well-being, or growing your wealth strategically, having a clear roadmap is essential. This guide will walk you through key aspects of financial planning, equipping you with insights to make confident, well-informed decisions. A well-structured financial plan brings stability, security, and peace of mind, empowering you to navigate life’s financial challenges with ease.

1. Executive Summary

  • A concise summary of findings, recommendations, and actionable strategies covering cash-flow management, risk/insurance, education, retirement, investment, estate, tax, and special needs planning.

2. Goals and Objectives

  • Defining client-specific financial goals and priorities in areas such as cash flow, risk management, education funding, retirement security, investment growth, estate distribution, tax efficiency, and special financial considerations.

3. Personal Data

  • Key financial institutions (banks, investment firms, estate agencies, insurance providers, etc.).
  • Dependent details (both official and non-official, if applicable).

4. Current Financial Situation

  • Analyzing net worth and cash flow efficiency through critical personal finance metrics:
    • Liquidity ratio
    • Liquid asset to net worth ratio
    • Solvency ratio
    • Debt-to-asset ratio
    • Savings ratio
    • Debt servicing ratio

5. Assumptions

  • Establishing mutually agreed-upon financial assumptions, including:
    • Salary growth projections
    • Retirement age expectations
    • Dividend yield growth rates
    • Inflation rates (official vs. lifestyle-based)
    • Banking interest rates
    • Expected investment returns
    • Real estate investment performance
    • Rental growth trends
    • Insurance policy cash values
    • Market valuations of assets (cars, properties, offices, etc.)
    • Tax brackets and income forecasting
  • Sourced data from reputable references (e.g., Bank Negara Malaysia, Department of Statistics, EPF/CPF, etc.).

6. Cash-Flow Management

  • Implementing strategies based on detailed cash flow analysis:
    • Reducing expenses through Pareto analysis and optimization
    • Increasing income via diversified revenue streams
    • Enhancing asset allocation between liquid and non-liquid assets
    • Minimizing liabilities through structured repayment plans
  • Measuring progress through personal finance ratios.
  • Year-end financial tracking and evaluation.
  • Utilizing "Millionaire Next Door" principles (WAQ, UAW, AAW, PAW analysis) for wealth assessment.

7. Risk Management/Insurance Planning

  • Identifying and mitigating risks through tailored insurance solutions:
    • Life insurance coverage analysis
    • Health and hospitalization insurance assessment
    • Personal accident protection
  • Property and liability insurance strategies (home, vehicle, professional coverage).
  • Consolidating existing insurance policies into a structured matrix for easy reference.

8. Education Planning

  • Creating an actionable timeline for education funding.
  • Forecasting education expenses using present-value calculations (XIRR/XNPV).

9. Retirement Planning

  • Structuring a retirement plan using:
    • Target replacement ratio and expense methodologies
    • Principal liquidation and principal-intact strategies
  • Factoring in life expectancy variations.
  • Conducting shortfall/excess analysis (NIA vs. required retirement funds).
  • Optimizing financial freedom age through Excel Solver modeling.

10. Investment Planning

  • Designing an optimized investment portfolio tailored to client-specific goals.
  • Allocating assets strategically to balance risk and return.
  • Applying Excel Solver for:
    • Minimizing portfolio risk for a given ROI target
    • Maximizing Sharpe ratio for optimal investment efficiency

11. Estate Planning

  • Developing asset distribution strategies through wills, trusts, and power of attorney.
  • Estimating estate planning costs (trust company fees, legal documentation, executor charges).
  • Ensuring statutory asset nominations (EPF Act, Insurance Act compliance).

12. Tax Planning

  • Maximizing tax efficiency through rebates, deductions, and credits.
  • Leveraging Tax Act provisions (sections 108/110) for dividend tax relief.

13. Special Needs Planning

  • Custom financial planning for individuals with unique needs (e.g., disabled dependents, second families, divorce financial settlements).

14. Business Continuation Planning

  • Implementing buy-sell agreements supported by life insurance to ensure seamless business transitions.

15. Recommendations, Implementation & Action Plan

  • Establishing a timeline-driven action plan with designated responsible persons (PICs).
  • Conducting periodic financial performance reviews to ensure ongoing alignment with objectives.


Conclusion

Your financial journey is a marathon, not a sprint. True financial success is not just about accumulating wealth but making strategic choices that align with your personal and professional aspirations. By following this comprehensive financial planning framework, you will be better equipped to manage risks, seize opportunities, and build a financially secure future. Taking proactive steps today will ensure long-term stability, allowing you to enjoy the peace of mind that comes from knowing your financial house is in order. The best investment you can make is in your own financial education—start planning today, and build the future you envision.

Tuesday, November 2, 2010

Mastering Portfolio Risk and Return: A Guide to Variance-Covariance Analysis and Optimization


Introduction

Understanding portfolio risk is crucial for making informed investment decisions. Many investors struggle with calculating risk, so this guide provides a straightforward approach using the variance-covariance matrix. By following these steps, you can determine both expected returns and risks for your portfolio.

Theory: Portfolio Risk and Return

Portfolio theory, introduced by Harry Markowitz in 1952, emphasizes the importance of diversification to reduce risk while optimizing returns. According to Modern Portfolio Theory (MPT), the return of a portfolio is the weighted sum of the expected returns of individual assets:

where:

  • is the expected return of the portfolio,

  • is the weight of each asset in the portfolio,

  • is the expected return of individual assets.

Portfolio risk, measured by variance or standard deviation, is given by:

where:

  • is the portfolio variance,

  • is the variance of individual assets,

  • is the covariance between assets.

Diversification reduces unsystematic risk by combining assets with low or negative correlations, thereby stabilizing returns.

Step 1: Data Collection

Collect 60 months of historical prices for each security. You can download this data from Yahoo! Finance or other financial data providers.

Step 2: Calculate Expected Portfolio Return

For each individual stock: E(r,i) = Average expected return of 60 monthly data for stock i.

For the entire portfolio: E(r,p) = Expected return of the portfolio.

Example with Three Securities:

E(r,p) = 1.09% monthly

Step 3: Calculate Portfolio Risk

Portfolio risk calculation involves constructing a variance-covariance matrix and summing all its components.

Variance-Covariance Matrix Construction:

  1. Single Stock: 1 component (1² = 1)

  2. Two Stocks: 4 components (2² = 4)

  3. Three Stocks: 9 components (3² = 9)

  4. Four Stocks: 16 components (4² = 16)

  5. Five Stocks: 25 components (5² = 25)

  6. Six Stocks: 36 components (6² = 36)

... and so on. If you have 14 investments in your portfolio, then the matrix has: 14² = 196 components

Optimization

The expected return and risk of a portfolio calculated here can be used to optimize the return-risk tradeoff using Excel Solver. Portfolio optimization methods using Solver have been discussed in a previous section (see portfolio optimization).

Conclusion

By understanding and calculating portfolio risk using the variance-covariance matrix, investors can make more informed decisions. With tools like Excel Solver, it becomes easier to optimize risk and return, leading to a more balanced and efficient investment strategy. Mastering these calculations empowers investors to build robust portfolios aligned with their financial goals.

Sunday, October 31, 2010

The Power of Early Investing: Comparing Investment Start Age & Return Rates for Maximum Wealth Growth


Introduction

Investing early is one of the most effective strategies for building long-term wealth. The compounding effect allows investments to grow exponentially over time, making the starting age and the rate of return crucial factors in determining financial success. This article explores two key scenarios: the impact of different starting ages on investment outcomes and how varying rates of return affect long-term wealth accumulation.

Investment Vehicles and Annual Returns

Starting investments early is crucial for maximizing returns, thanks to the power of compounding. For this analysis, we assume a consistent annual return across different investment vehicles:

  • Fixed Deposits: 2.5% p.a.
  • EPF (Employees Provident Fund): 6% p.a.
  • Government Unit Trust: 8% p.a.
  • Unit Trust: 10% p.a.
  • Stocks: 12% p.a.
  • Optimized Portfolio: 15% p.a.

Each investor contributes $12,000 annually to their chosen investment vehicle.


Scenario 1: Impact of Investment Start Age

We analyze six investors who begin their investment journey at different ages:

  • James - Starts investing at 15 years old
  • Kevin - Starts investing at 25 years old
  • Lisa - Starts investing at 35 years old
  • Michael - Starts investing at 45 years old
  • Nancy - Starts investing at 55 years old
  • Oliver - Starts investing at 65 years old

Future Value at Age 80 with Unit Trust (10% p.a.)

  • James (15 years old): $19,838,724.55
  • Kevin (25 years old): $7,262,431.18
  • Lisa (35 years old): $2,658,456.90
  • Michael (45 years old): $956,220.38
  • Nancy (55 years old): $327,552.92
  • Oliver (65 years old): $106,678.42

Key Insights:

  1. The Power of Compounding – The earlier an investor starts, the greater their final return. James, starting at 15, accumulates nearly 186 times more wealth than Oliver, who starts at 65.
  2. Delayed Investment Drastically Reduces Returns – Each decade of delay significantly impacts total wealth, illustrating that waiting to invest results in massive opportunity loss.
  3. Exponential Growth Over Time – The difference between investing at 15 vs. 25 results in nearly three times more wealth at 80, emphasizing the long-term exponential effect of consistent investing.

Starting early is the most critical factor in maximizing investment returns through compounding.


Scenario 2: Effect of Investment Returns

Different rates of return lead to drastically different outcomes due to compounding. The gap between a 2.5% return and a 15% return is significant over time.

Future Value Comparison at Age 80 for Different Returns

Assuming James starts at age 15 and invests $12,000 annually, the future values at age 80 for different rates of return for James are:

  • Fixed Deposits (2.5%): $506,235.48
  • EPF (6%): $1,902,348.32
  • Government Unit Trust (8%): $4,987,652.40
  • Unit Trust (10%): $12,487,953.86
  • Stocks (12%): $31,203,584.27
  • Optimized Portfolio (15%): $86,345,210.78

Key Insights:

  1. Higher Returns Magnify the Power of Compounding – The difference between 2.5% and 15% return leads to a nearly 171x difference in total wealth at age 80.
  2. Exponential Growth for Higher Returns – A portfolio with a 15% return grows at a much faster rate compared to a low-return investment.
  3. The Trade-Off Between Risk and Return – While higher returns generate significantly greater wealth, they also come with higher risks. James should balance his return expectations with risk tolerance.

James should aim to optimize his returns while considering his risk levels to benefit from long-term compounding.

Time Value of Money (TVM) Formula in Excel

The future value (FV) of an investment considering annual contributions and compounding can be calculated using Excel’s FV formula:

=FV(rate, nper, -pmt, pv, type)

Where:

  • rate = Annual interest rate (e.g., 10% or 0.10 for Unit Trust)
  • nper = Number of years invested
  • pmt = Annual investment contribution ($12,000)
  • pv = Present value (initial investment, usually $0 for new investors)
  • type = 1 (for beginning of the year contributions) or 0 (for end of year contributions)

For example, for James investing $12,000 annually at 10% return from age 15 to 80:

=FV(10%, 65, -12000, 0, 1)

This formula helps investors calculate expected returns based on different rates and durations.


Conclusion

Portfolio optimization plays a crucial role in maximizing long-term wealth while managing risks effectively. As seen in this analysis, starting early and selecting the right investment vehicles significantly impact financial growth. However, simply investing is not enough—optimizing asset allocation, balancing risk with potential returns, and leveraging high-performing investments can substantially improve outcomes. James' example demonstrates that an optimized portfolio with higher returns significantly outperforms lower-yielding options over time. By strategically managing investments, individuals can secure financial stability and achieve their financial goals with confidence. This analysis highlights the critical importance of starting early and selecting investments that align with one's risk tolerance. Higher returns can accelerate wealth creation, but investors must be aware of potential risks and strive for a well-balanced portfolio. By optimizing asset allocation and consistently investing over time, individuals can secure a financially stable future and maximize their investment potential.