
Asimo works hard to earn steady monthly salary. Due to robot never spend any single penny (or, maybe do not know how to spend), the net worth pattern shall be look like a staircase type.
Characteristic: No human being is classified into this category. But, it shows that it is the maximum amount that one can earn from this single source of income for the rest of the life time.

Mr. Savi awares about the saving is important. Thus, he works hard to increase his net worth through his single source of income, most likely it is through the employment.
Characteristic: Consumption Outflow lesser than Monthly Salary Inflow
Ms. Balanec seems to know well about the balance of spending and earning perfectly. Perhaps, she has no trust on financial planning. Spend all as per earned. She really knows how to enjoy life...young.
Characteristic: Consumption Outflow same as Monthly Salary Inflow

Mr. Brooke believes in today money more worth than tomorrow, so he spends it all using his future money from credit card. How to finance his high consumption outflow? Perhaps, his father is rich...very rich.
Characteristic: Consumption Outflow higher than Monthly Salary Inflow

Ms. Exponen works and has developed passive incomes or another stream of active incomes.
Characteristic: Consumption Outflow is offset by multi source of income that generates exponential effect growth from the existing net worth. Due to the effect of strong inflow, she has no worry on her basic/fixed month expenses.
What is your time series pattern?

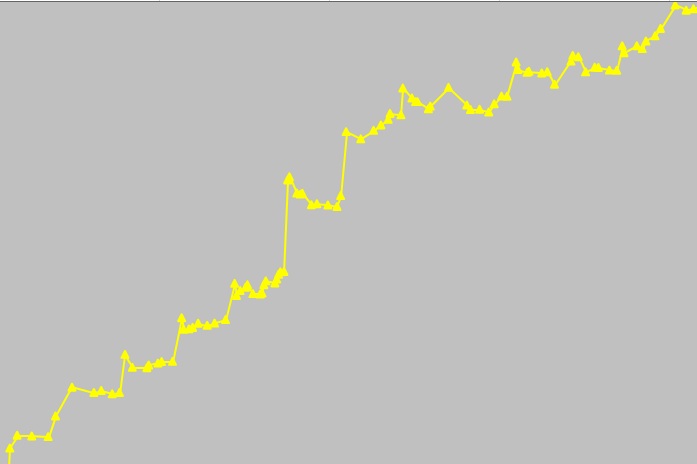
Every success starts with a hard way, always.
This is the actual time series pattern which I just started my plan. The execution is hard but it is not an impossible task.

After years, the trend changes to exponential or higher linear growth trend. It is the results of
1) increasing the capability of inflow,
2) use the increased amount of inflow to buy appreciating asset,
3) reduce liability, and
4) controlled outflow.
It is as simple as ABC, just the matter of the cashflow management. But, how many people can do that?

Every success starts with a hard way, always.
This is the actual time series pattern which I just started my plan. The execution is hard but it is not an impossible task.
After years, the trend changes to exponential or higher linear growth trend. It is the results of
1) increasing the capability of inflow,
2) use the increased amount of inflow to buy appreciating asset,
3) reduce liability, and
4) controlled outflow.
It is as simple as ABC, just the matter of the cashflow management. But, how many people can do that?

